Tracing Kernel Functions in Linux
Kernel Function Tracing: The Basics

Kernel Function Tracing: The Basics
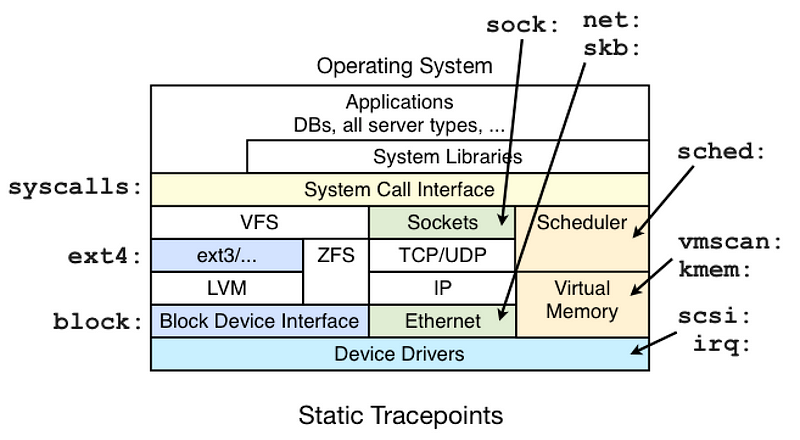
Kernel function tracing involves tracking the execution of functions within the kernel code.
This helps developers identify performance bottlenecks, debug issues, and optimize kernel code execution. The Linux kernel provides several mechanisms to facilitate low-level tracing, including:
- Tracepoints: Predefined instrumentation points in the kernel that allow you to gather information about function entry and exit events.
- Kprobes: Dynamic tracing mechanism for probing any kernel function, allowing developers to collect information about function execution without modifying the kernel source code.
- Ftrace: A built-in tracing framework in the Linux kernel, which utilizes tracepoints and kprobes for function tracing and provides various tracing options.
Using Ftrace for Kernel Function Tracing
Ftrace is a powerful and versatile tracing tool in the Linux kernel’s debug filesystem.
It provides several tracing options, such as function tracing, function graph tracing, and event tracing.
To use Ftrace, you need to mount the debug filesystem and navigate to the ‘trace’ directory:
$ sudo mount -t debugfs none /sys/kernel/debug
$ cd /sys/kernel/debug/tracing
Function tracing
Function tracing in Ftrace allows you to track the entry and exit of kernel functions. To enable function tracing, you can use the following commands:
$ echo function > current_tracer
$ echo 1 > tracing_on
You can view the traced function calls in the ‘trace’ file:
$ cat traceTo disable function tracing, use the command:
$ echo 0 > tracing_onFunction Graph Tracing
Function graph tracing provides a more detailed view of function calls, including call duration and nested function calls.
Enable function graph tracing with the following commands:
$ echo function_graph > current_tracer
$ echo 1 > tracing_on
Dynamic Tracing with Kprobes
Kprobes is a dynamic tracing mechanism that allows you to instrument any kernel function without modifying the kernel source code.
Kprobes inserts a breakpoint at the specified function and executes a user-defined probe handler when the breakpoint is hit.
You can use the ‘kprobe_events’ file to register and unregister kprobes:
$ echo 'p:myprobe target_function' > kprobe_events
$ echo 1 > events/kprobes/myprobe/enable
To unregister a kprobe, use:
$ echo 0 > events/kprobes/myprobe/enable
$ echo '-:myprobe' > kprobe_events
Advanced Tracing with BPF and BCC
BPF (Berkeley Packet Filter) is a powerful in-kernel virtual machine that allows you to run custom programs in the kernel context and has gained increased adoption by key industry players.
Learn more about eBPF in this article and this first steps guide.
Check it out!
Conclusion
Tracing kernel functions at a low level is essential for Linux developers and system administrators.
Linux offers various tools and mechanisms, such as Ftrace, kprobes, eBPF, and BCC, to enable effective kernel function tracing.
By understanding and utilizing these tools, you can analyze kernel behaviour, optimize system performance, and troubleshoot complex issues in the Linux operating system.
Stay tuned, and happy coding!
Visit my Blog for more articles, news, and software engineering stuff!
Follow me on Medium, LinkedIn, and Twitter.
All the best,
Luis Soares
CTO | Head of Engineering | Blockchain Engineer | Web3 | Cyber Security | Golang & eBPF Enthusiast
#eBPF #linux #kernel #probes #events #hooks #bytecode #virtualmachine #devops #helm #LLVM #compiler #application #softwaredevelopment #softwareengineering #backend #development #softwaredesign #security #technology #networking


